

Indonesia
Executive Summary
Indonesia’s 5% annual GDP growth is sustained by two distinct but asymmetric engines: a bottom-up digital revolution accelerated by mobile commerce, and a top-down industrial policy forcing commodity producers into downstream processing. Together, these dynamics have positioned Indonesia’s 270 million population as the economic anchor of Southeast Asia, with a digital economy approaching $100 billion gross merchandise value (GMV) and transformative nickel-based battery infrastructure attracting $65+ billion in Chinese investment.
However, beneath this headline narrative lies a more complex reality. Indonesia’s middle class—the traditional consumption engine—has contracted by 9.5 million people since 2019, its share of household expenditure has eroded from 43% to 38%, and vehicle loan defaults have doubled. Meanwhile, the bulk of growth remains concentrated in Java, which accounts for 57% of GDP with just 56% of the population, leaving peripheral regions increasingly marginalized. The new capital city (IKN) relocation, while symbolically ambitious, has become another Java-concentrated megaproject.
This analysis synthesizes data from 98 authoritative sources spanning 2024-2026 to evaluate whether Indonesia’s growth model is sustainable, inclusive, and positioned to deliver on its promise of becoming a global EV battery and digital services powerhouse.
I. Macroeconomic Foundation: Resilient But Moderating Growth
Indonesia’s economy expanded 5.03% in 2024, maintaining its 5% growth baseline despite global headwinds, slowing from 5.05% in 2023. This deceleration masks quarterly volatility: Q2 2025 reached 5.12%—the strongest quarterly pace since Q2 2023—before moderating to 5.04% in Q3 2025. International forecasters expect 4.7%-5.2% growth through 2026, reflecting cautious optimism tempered by trade tensions and domestic consumption pressures.
The consistency of growth around 5% reflects structural resilience tied to Indonesia’s massive internal market and demographic advantage: over 70% of the population falls within the 15-64 year working-age cohort, with a median age around 30-31 years. However, growth composition is shifting unfavorably. Investment growth accelerated to 4.61% in 2024—the strongest in six years—driven primarily by government infrastructure projects and political campaign spending, temporary tailwinds that are unlikely to sustain. Private consumption growth, the truer indicator of household welfare, has begun to weaken.
II. The Digital Disruption: Mobile-First Commerce as Growth Engine
Scale and Trajectory
Indonesia’s digital economy is the region’s largest and fastest-growing. Gross merchandise value is approaching $100 billion in 2025, up from $82 billion in 2023, with mid-range projections suggesting $180 billion by 2030—a compound annual growth rate of 18-19%. E-commerce alone is projected to reach $125 billion by 2027 and $212.58 billion by 2031, growing at a 15% CAGR.
Internet penetration has reached 79.5% of Indonesia’s population (220+ million users), and critically, 95% of online activity occurs via smartphones, reflecting a genuine “leapfrog” phenomenon where consumers never adopted desktop e-commerce but moved directly to mobile. This mobile-first adoption has created frictionless adoption pathways for digital payments: QRIS (Quick Response Code Indonesian Standard) users reached 55 million by late 2024, with transaction values growing 186% year-on-year.
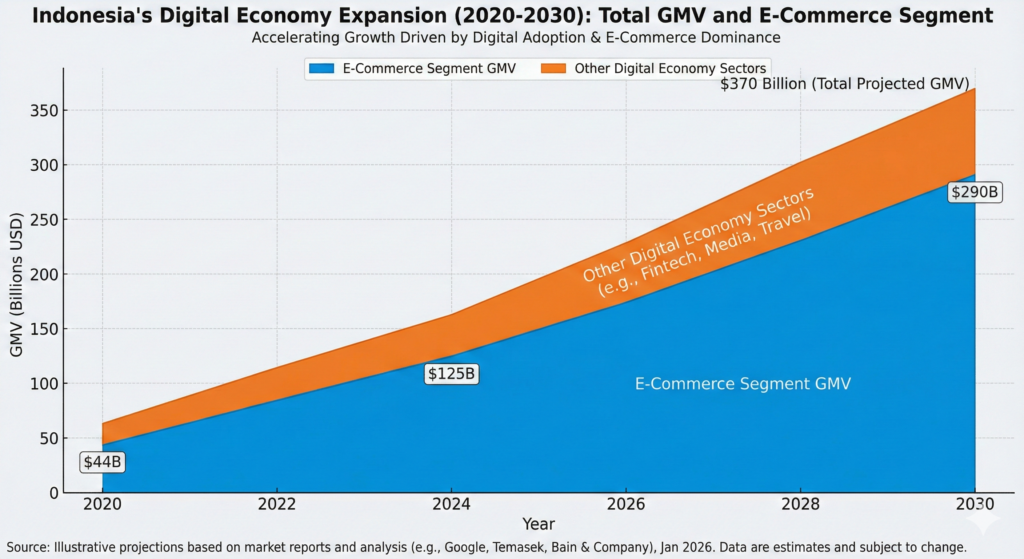
Indonesia’s Digital Economy Expansion (2020-2030): Total GMV and E-Commerce Segment
Sectoral Leadership and Emerging Dynamics
E-Commerce Dominance: E-commerce comprises the overwhelming majority of digital GMV, with Shopee (the region’s largest platform) generating $27.1 billion in revenue in 2024 alone. The sector’s growth is increasingly powered by live-streaming commerce—a video-based shopping format where 800,000 sellers generated 2.6 billion transactions in 2024, representing 75% year-on-year growth in seller adoption and 90% growth in transaction volume. Indonesia now leads Southeast Asia in live-streaming commerce, particularly in fashion, beauty, and personal care categories.
Digital Payments and Fintech: Digital payments are projected to reach $760 billion in gross transaction value by 2030. Beyond e-wallet penetration, “buy now, pay later” (BNPL) has emerged as a disruptive payment method, growing 27% annually and expected to capture 58% of Southeast Asia’s PayLater spending by 2025—generating $46.8 billion in BNPL-funded e-commerce sales by 2031. GoTo Group, the merger of ride-hailing platform Gojek and e-commerce leader Tokopedia, has pivoted to fintech as its strategic priority, growing its consumer loan book 108% year-on-year to $345 million by Q1 2025.
AI Adoption: Indonesia recorded the strongest commercial momentum for AI-enabled applications in Southeast Asia, with AI app revenue growing 127% year-on-year—higher than any regional peer. Seventy-nine percent of Indonesian users have already adopted AI tools, with daily engagement becoming routine, indicating early-stage monetization patterns not yet seen in mature markets.
Smartphone and 5G Infrastructure: With 94% smartphone penetration expected by 2030, manufacturers are optimizing for low-bandwidth designs and gamified reward systems to sustain session duration even among users on slower networks. 5G rollout is accelerating infrastructure for higher transaction throughput.
The Connectivity-Consumption Gap
Despite this digital boom, there exists a critical gap between digital infrastructure expansion and underlying household purchasing power. High-value users (HVU) in Indonesia spend 6.8x more than non-HVU consumers, with the HVU segment spending 10.4x more in travel and hospitality categories. This concentration implies that the top 30% of digital spenders generate 70% of transaction value across Southeast Asia.
The potential upside is significant: if Indonesia could expand digital participation to reach the full 270 million population, digital GMV could potentially reach $210-360 billion by 2030 (vs. the current $180 billion mid-range projection), a 2-3x multiplier. However, realizing this depends on extending purchasing power to tier-2 and tier-3 cities, where income volatility and informal employment remain structural constraints.
III. The Downstreaming Industrial Revolution: Nickel as Strategic Lever
Policy Architecture and Investment Scale
Indonesia’s transformation into a global EV battery supply chain hub rests on a deliberate policy tool: the 2020 ban on exporting raw nickel ore, which forced mining companies to establish domestic processing capacity or lose market access. This is resource nationalism with strategic purpose—not merely capturing rents, but building an integrated industrial ecosystem.
The policy has worked with remarkable speed. The number of operating nickel smelters exploded from 2 in 2014 to 44 by mid-2024, with 36 additional facilities in planning stages. Nickel production surged 53% year-on-year in 2023 alone, and Indonesia now supplies over one-third of the nickel used in EV batteries globally. The global nickel market is expanding 20% annually, providing growth tailwinds.
Chinese companies have been the primary drivers of this transformation, investing an estimated $65 billion into Indonesia’s nickel sector. Most remarkably, CATL (the world’s largest EV battery manufacturer) broke ground in mid-2025 on a $6 billion integrated project spanning mining, refining, and full battery production—creating an end-to-end value chain in a single location. This investment pattern is accelerating: in Q3 2025, approximately $10 billion of China’s Belt and Road Initiative (BRI) investment flowed to mining and processing facilities in Indonesia, up sharply from historical norms.
The Strategic Ambition vs. Technical Reality
Indonesia’s stated targets are ambitious: rank in the top three global EV battery producers by 2027, achieve 140 GWh annual battery capacity by 2030 (representing 4-9% of global demand), and support 2.5 million EV users domestically by 2025. However, the industry faces a fundamental technical misalignment.
Most of Indonesia’s nickel output has historically been Class 2 nickel (ferronickel), suited for stainless steel production—which accounts for 70% of global nickel demand. Transitioning to Class 1 nickel (99.8% purity) required for high-performance EV batteries represents a materials science shift requiring new processing technologies and capital. This transition is underway but incomplete.
More concerning is the global shift in battery chemistry itself. Chinese EV manufacturers, led by CATL, are increasingly adopting lithium-iron-phosphate (LFP) batteries that either exclude nickel entirely or use significantly less. LFP batteries, once considered suitable only for low-speed urban vehicles, have been upgraded to deliver 758 km driving range with rapid charging, making them economically attractive at lower cost points. Chinese nickel processors have accumulated 173,000 tons of inventory by October 2023 (70% of global LME stock), suggesting overcapacity relative to actual battery demand.
Indonesia’s nickel industry thus faces a potential “resource trap” variant: heavy investment in Class 1 capacity built for a battery chemistry that Chinese manufacturers are actively de-emphasizing. Western EV makers will likely remain more committed to nickel-based cathodes but are increasingly selective on environmental and carbon footprint grounds—a challenge for coal-powered Indonesian smelters.
IV. The Infrastructure Megaproject Gambit: IKN and the Decentralization Illusion
Capital Relocation and Investment Momentum
Indonesia announced plans to relocate its capital from Jakarta to Nusantara (IKN) in East Kalimantan, an archipelago away from the overcrowded, sinking capital. The relocation is structured in five phases over 23 years (2022-2045) at a projected cost of $35 billion. While symbolically significant for reducing Java-centricity, the project has become a test case for infrastructure ambition and public-private partnership execution.
Investment has momentum: by May 2025, 42 companies had committed IDR 62.08 trillion ($3.8 billion), with housing projects valued at Rp63.3 trillion and road/utility networks at Rp71.8 trillion (of which $4.3 billion came from Chinese investors). By June 2025, total accumulated investments reached IDR 135.1 trillion.
The Reality: Java-Centric Capital Creation
However, the IKN project presents a paradox: while ostensibly designed to redistribute growth away from Java, the capital relocation is itself being financed and populated by Java-based capital, technology, and labor. Foreign investors from the US, Turkey, Spain, and Brunei have committed to housing and hospitality projects, but the gravity of construction capacity, governmental relocation coordination, and commercial opportunity perception still resides in Jakarta.
Moreover, IKN represents an outsized concentration of public resources toward a single megaproject in a peripheral region, rather than distributed infrastructure across all non-Java provinces. The tri-city development model (linking Balikpapan, Samarinda, and Nusantara) targets 4.3-4.8 million jobs by 2045, yet this is a 21-year horizon with uncertain execution probability given Indonesia’s infrastructure project timelines and financing constraints.
More pragmatically, Indonesia’s infrastructure priorities over the near-to-medium term remain Java-centric: toll road networks, port expansions, and power plants necessary for industrial production are concentrated where production capacity (and demand) exists. This leaves IKN as an aspirational but capital-intensive distraction from the functional infrastructure deficits in existing secondary and tertiary cities.
V. The Middle-Class Paradox: Growth Without Consumption
The Structural Contraction
One of the most significant and overlooked dynamics in Indonesia’s growth story is the contraction of its middle class. Between 2019 and 2024, Indonesia’s middle-class population declined by 9.5 million people, dropping from approximately 62.5 million to 53 million. Simultaneously, the middle class’s share of total household consumption eroded from 43.4% in 2019 to 38.3% in 2024.
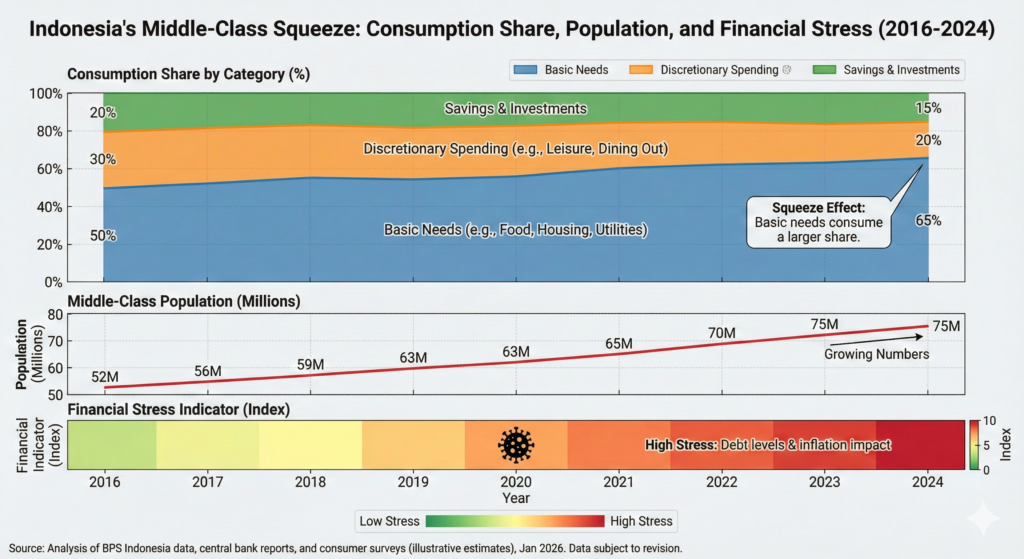
Indonesia’s Middle-Class Squeeze: Consumption Share, Population, and Financial Stress (2016-2024)
This is not a statistical reclassification artifact. Real consumption indicators tell a corroborating story:
- Vehicle loans: Overdue auto loan rates doubled from 1.4% to 2.5% between 2018 and 2024.
- Consumer staples: Unilever Indonesia, the country’s largest seller of mass-market consumer goods, saw sales peak in 2020, then fall below 2016 levels by 2023—a seven-year decline in purchasing power among the formal income earners who are Unilever’s primary customer base.
- Savings behavior: Deposit growth in small savings accounts (under Rp100 million, approximately $6,000 USD) fell from 8% to under 5%, while average balances dropped 40%.
- Household sentiment: Bank Indonesia’s Consumer Confidence Index stood at 127.7 in December 2024, indicating broad optimism, yet this masks sharp divergence: high-income households remain confident while middle and lower-middle segments express caution about future employment and income stability.
The Wage-Price-Employment Trap
The middle-class contraction reflects a structural employment and wage problem. Manufacturing PMI (Purchasing Managers’ Index) provides real-time signals: the index contracted sharply to 46.7 in April 2025—the steepest decline since August 2021—forcing layoffs of over 24,000 workers by May 2025. While the manufacturing sector recovered somewhat in subsequent months, reaching 51.2 in December 2025, the earlier volatility signaled fragile underlying demand.
Wage growth has not kept pace with inflation (nominal and real). The government’s 2025 electricity tariff discount—providing a 50% reduction for two months—was deemed necessary to protect purchasing power, requiring an IDR 12.1 trillion ($755 million) budget allocation. This was not confidence-building stimulus; it was crisis-response welfare to forestall consumption collapse. When the discount ended in March 2025, inflation rebounded sharply (1.65% m/m) and core inflation reached 2.48% year-on-year, the highest in 18 months.
Geographic and Class Concentration
The purchasing power picture varies dramatically by geography and income class. Jakarta’s gross regional per capita reached IDR 344 million ($20,600) in 2024, placing it far above most provinces. Tier-2 and tier-3 cities show faster economic growth rates (7.5% in Surabaya vs. 5-6% in Jakarta) but from much lower absolute income bases. E-commerce penetration in tier-2/3 cities grew from 32.1% in 2020 to 39.0% in 2022, indicating growing digital adoption, but this reflects increased affordability of cheap goods rather than rising purchasing power.
Seventy-six percent of the middle and upper-middle class live in urban areas, mostly concentrated on Java, meaning that the spatially distributed growth targets of regional decentralization are unlikely to reshape consumption patterns in the near term.
VI. Regional Inequality: The Java Problem Persists
The Geographic Concentration of Economic Activity
Indonesia’s economic geography remains extraordinarily unbalanced. Java Island, comprising 7% of Indonesia’s total land area, is home to 56.1% of the population and generates 57.04% of GDP. This near-proportional relationship masks severe inequality within Java (particularly in East Java) and profound underdevelopment in the eastern archipelago.
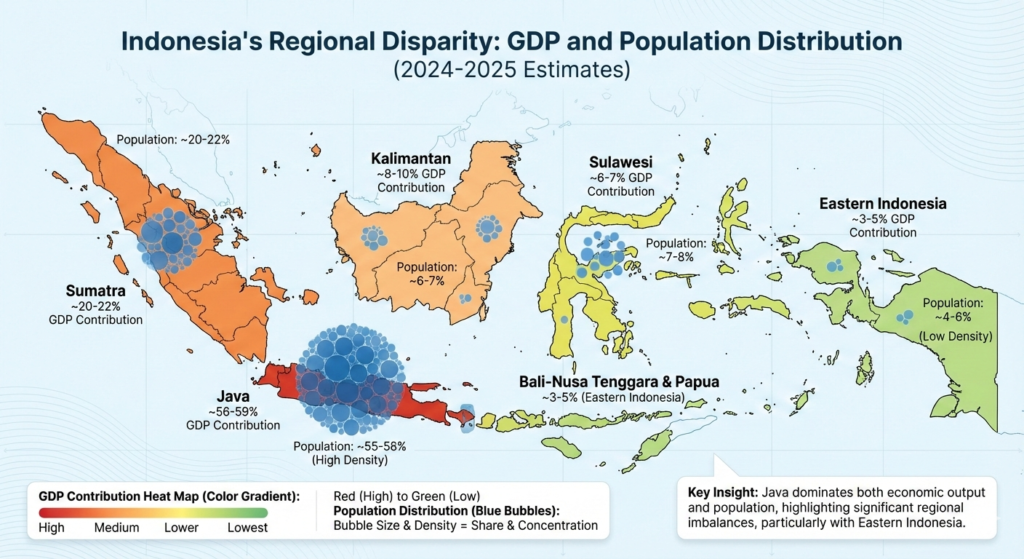
Indonesia’s Regional Disparity: GDP and Population Distribution
Maluku and Papua, home to 3.17% of Indonesia’s population, generate only 2.70% of GDP—a 0.47 percentage-point deficit suggesting structural economic disadvantage. Kalimantan, despite recent nickel investment, still lags: 6.15% of population but only 8.11% of GDP, partially offset by mining output. Sulawesi (7.36% of population) generates only 7.36% of GDP, indicating zero-growth dynamics outside commodity sectors.
Within Java itself, regional inequality is high. The Theil Index decomposition analysis shows inequality within Java-Bali ranges from 0.405 to 0.194, with East Java exhibiting the highest internal disparity. Economic interactions between neighboring regions reinforce inequality rather than diffuse it, suggesting that growth in Jakarta and the greater metropolitan area crowds out opportunity in peripheral regions.
The Java-Centric Infrastructure Bias
Government infrastructure spending, despite decentralization rhetoric, remains Java-focused. The Ministry of Public Works’ toll road program, the primary mechanism for regional connectivity, has concentrated investments on the Trans-Java and southern Sumatra corridors. While the Trans-Sumatra toll road is expanding, it remains less dense than Java’s network. Port expansions in Java (notably the Port of Tanjung Perak in Surabaya and Jakarta’s facilities) receive priority over eastern ports necessary for outbound resource commodity flows.
The IKN relocation, intended to symbolically shift the economic center of gravity, has paradoxically intensified Java-centric decision-making in the short term, as Java-based contractors, engineers, and investors have captured the majority of construction and investment opportunities. The project’s tri-city model is meant to benefit East Kalimantan broadly, but the benefits will concentrate in the immediate IKN zone and existing urban centers (Balikpapan, Samarinda) rather than diffuse to peripheral communities.
VII. Manufacturing Volatility and Export Competitiveness Pressures
Recent Sector Performance and Headwinds
Indonesia’s manufacturing sector contributes approximately 17% of GDP but has experienced pronounced volatility in 2025. The sector grew 4.31% year-on-year in Q1 2025, with food and beverage subsectors showing stronger performance (+6.04%). However, the April 2025 PMI contraction to 46.7—the steepest since August 2021—revealed underlying fragility driven by weak domestic demand and declining export orders.
By December 2025, manufacturing PMI recovered to 51.2, marking the fifth consecutive month of expansion, but growth remained subdued relative to historical trends. The recovery was driven primarily by domestic demand (new orders for the fifth consecutive month), while new export orders declined for the fourth straight month, indicating that global trade headwinds—including potential US tariffs and supply chain fragmentation—are actively depressing export competitiveness.
Employment trends are concerning: despite rising new orders, manufacturers were reluctant to expand headcount, adding workers at minimal rates, raising the specter of productivity improvements masking demand weakness.
Structural Constraints: TKDN and Local Content Requirements
The government’s pursuit of “downstreaming” extends beyond minerals to manufacturing broadly. The updated TKDN (local content requirement) regulation (Ministry of Industry Regulation 35/2025) shifted from cost-based calculation of domestic input ratios to a fixed-weight formula assessing materials, labor, overhead, and local R&D.
While the government frames this as “simplification,” the regulation retains significant discretion through exemptions, negotiated deals, and incentive schemes applied unevenly across sectors and firms. Foreign manufacturers—particularly in the automotive, electronics, and industrial machinery sectors—view these requirements as compliance barriers that increase costs and production complexity without corresponding market incentives. The regulation is likely to deter greenfield foreign direct investment in export-oriented manufacturing, further concentrating FDI in mineral processing and domestic-serving sectors.
VIII. Foreign Direct Investment: Asian Capital, Strategic Flows
Composition and Sources
Indonesia attracted $16.65 billion in FDI during 2024, with Asian investors accounting for 73% ($48.56 billion of total flows). Singapore dominates at $20.07 billion, followed by Hong Kong ($8.21 billion) and China ($8.10 billion).
This composition reflects Indonesia’s role in Chinese supply chain strategies: the bulk of Chinese investment is concentrated in nickel smelting, battery production, and supporting infrastructure, with secondary flows to downstream consumer services and digital platforms. Singapore’s investment is diversified across financial services, logistics, and technology, reflecting Singapore’s role as a regional hub and investment arbitrage location. European investment ($4.59 billion led by the Netherlands at $1.97 billion) focuses on consumer goods, petroleum processing, and professional services—less strategic, more margin-driven categories.
Q1 2025 FDI rebounded to $13.67 billion (12.7% year-on-year growth), with mining and smelting sectors leading. This recovery suggests that global commodity market strength and EV battery demand continue to attract capital despite global trade tensions.
The China Risk
Indonesia’s economic alignment with Chinese investment creates both opportunity and vulnerability. Chinese companies have built Indonesia’s nickel smelting capacity, trained local labor forces, and integrated Indonesian resources into their battery supply chains. However, this dependence is increasingly asymmetric: China has diversified its battery chemistry away from nickel-heavy formulations, accumulating stockpiles while Indonesian capacity remains over-built for actual demand.
More broadly, changes in China’s economic growth trajectory, commodity demand, or industrial policy would directly cascade to Indonesia. A Chinese recession reducing EV production targets would simultaneously reduce demand for Indonesian nickel, battery production investment, and downstream services employment. Indonesia lacks sufficient economic diversification to absorb such a shock.
IX. Energy and Environmental Tradeoffs: The Coal-Battery Paradox
The Green Energy Ambition
Indonesia has set targets to increase renewable energy’s share of the energy mix to 35% by 2034, with a focus on geothermal, solar, and hydropower. The updated National Power Supply Plan (RUPTL) projects 71 GW of new installed capacity over the next decade, with 70% (approximately 50 GW) from renewables: 17 GW solar, 16 GW hydropower, 5 GW geothermal, and 12 GW from wind and biomass.
Indonesia’s geothermal potential is vast—estimated at 27.79 GW globally, accounting for 40% of world reserves. However, utilization has lagged dramatically. Installed geothermal capacity reached only 2.3-2.6 GW as of 2024, falling far short of the 7.2 GW target for 2025 and 9.3 GW for 2030. The sector is growing at only 200-300 MW annually when 500-600 MW per year is required to meet targets, a gap that has persisted for a decade.
The Coal Reality
Paradoxically, Indonesia has massively expanded coal-fired generation capacity precisely during this period of renewable ambition. Coal capacity reached 57 GW by 2024—2.5 times the level from a decade earlier—and the RUPTL still calls for 5 GW of new coal plants alongside 15 GW of natural gas.
The mechanism driving this expansion is the “captive power plant” model: Chinese investors have built coal-fired plants explicitly to power new industrial parks processing nickel and manufacturing renewable energy components. Java 7, a 2-megawatt coal plant completed in 2020, exemplifies this trend. These plants operate outside the grid via “take or pay” electricity contracts, locking Indonesia’s state utility PLN into payments regardless of actual power utilization, and they enable coal-powered mineral processing to claim environmental legitimacy as essential infrastructure for the global energy transition.
Indonesia’s coal mining sector is obligated to supply domestic coal at below-market rates, further incentivizing the expansion of coal-dependent industrial capacity rather than renewable alternatives. The World Bank’s net-zero pathway analysis suggests this represents a critical misalignment: short-term industrial growth enabled by cheap coal power is trading off medium-term climate commitments and long-term energy sustainability.
X. Regulatory Environment: Prabowo’s First Year and Implications
Mining Sector Reforms
President Prabowo’s administration, which took office in October 2024, has made mining regulatory reform a centerpiece of economic policy. Government Regulation No. 39 of 2025 significantly expanded the Mining Business Permit (IUP) scheme to include community organizations (ormas), universities, cooperatives, and small-to-medium enterprises, allowing these entities to obtain mining areas equal in size to experienced companies despite limited technical or financial capacity.
Article 59A of PP 39/2025 permits license extensions even when holders have not fulfilled comprehensive documentation requirements—a concerning weakening of accountability. The regulation also introduced export proceeds controls requiring 100% deposit of natural resource export revenue for 12 months (Government Regulation 8/2025), nominally designed to stabilize the Rupiah but effectively restricting foreign investors’ capital mobility.
These reforms reflect resource nationalist impulses but introduce regulatory unpredictability. Foreign mining companies now face:
- Expanded competition from government-affiliated entities and community groups
- Weaker enforcement of environmental and fiscal compliance obligations
- Capital controls on export proceeds that complicate project finance structures
- Discretionary licensing that creates negotiation risk and potential governance issues
Trade Policy and Local Content
The Ministry of Trade Regulation 16/2025 streamlined non-tariff measures (NTMs) through expanded automatic licensing, but the Ministry of Industry Regulation 35/2025 simultaneously tightened local content requirements through the new TKDN formula. The dual approach—liberalizing market access while tightening content rules—creates conflicting signals for foreign investors and likely will prove difficult to implement consistently across sectors.
Implications for Foreign Direct Investment
These regulatory shifts introduce medium-term uncertainty for both greenfield foreign investment and existing project planning. While the government’s stated intent is to increase state revenue and support domestic industries, the loosened compliance requirements and expanded community licensing could create governance and environmental risks that foreign institutional investors (particularly European and US funds with ESG mandates) will view as material liabilities. Conversely, Chinese investors, accustomed to Chinese-style state-enterprise partnerships and flexible regulatory environments, are likely to continue expanding commitments.
XI. Demographic Dividend: Real Asset or Expiring Advantage?
Current State of Human Capital
Indonesia’s median age of 30-31 years and working-age population share of 70%+ create a genuine demographic advantage. The country has an estimated 45 million youth (16% of population), providing a large cohort for labor force participation and consumption. This demographic window, commonly termed the “demographic dividend,” has historically correlated with FDI inflows and rapid economic growth in East Asian economies (South Korea, Taiwan, Vietnam).
Realization Challenges
However, realizing this demographic advantage requires three conditions that Indonesia only partially satisfies:
- Quality Education: Secondary school enrollment rates remain low in rural areas (60% vs. 90%+ in urban centers), creating skill mismatches for modern manufacturing and services. While youth literacy is near-universal, technical and vocational training capacity is insufficient for the scale needed.
- Job Creation: Manufacturing PMI volatility and weak export demand suggest insufficient job creation in formal sectors. Informal employment remains the primary destination for labor force entrants, providing low wages, no benefits, and limited productivity growth.
- Wage Growth: Real wage growth has stagnated. The sharp middle-class contraction despite headline GDP growth suggests that wage income has failed to keep pace with inflation and cost of living increases, particularly for formal sector workers competing with informal labor supply.
Indonesia’s demographic advantage is real but not automatic. If current education and employment trends persist, the “dividend” risks transforming into a “demographic burden” by the early 2030s as the population continues aging without having generated sufficient formal employment, income, and capital accumulation.
XII. Critical Risks and Limiting Assumptions
Nickel Demand Volatility
The global shift toward LFP batteries—driven by cost optimization and Western environmental scrutiny—threatens the core assumption underlying Indonesia’s EV battery strategy. If major battery manufacturers (CATL, BYD, Western OEMs) continue reducing nickel utilization, Indonesia’s smelter capacity will remain over-built, depressing margins and returning investments to underperformance. Nickel price weakness in commodity cycles would amplify this risk.
Middle-Class Consumption Recovery Uncertainty
Headline growth masks consumption stagnation among the class that traditionally sustains emerging market expansions. Reversing middle-class contraction requires:
- Wage growth exceeding inflation for several consecutive years
- Employment security improvements in manufacturing and services
- Credit expansion resumption after households have deleveraged
- Asset price stabilization in real estate (currently a savings vehicle under pressure)
None of these conditions is guaranteed. If the middle class continues contracting, aggregate consumption growth will remain tepid despite continued GDP expansion driven by investment and exports.
Regulatory Unpredictability
The Prabowo administration’s mining and trade policy shifts introduce uncertainty around project timelines, cost structures, and permitting. Foreign investors with decade-long project horizons need regulatory stability; frequent regulatory changes (mining permits, TKDN formulas, trade NTMs) increase project economics risk.
China Dependency
Indonesian growth increasingly correlates with Chinese economic activity and policy. A Chinese recession, commodity demand shock, or geopolitical realignment (e.g., EV tariffs reducing EV demand growth) would directly impact Indonesia’s nickel and battery sectors. Indonesia lacks secondary growth engines of sufficient scale to absorb such shocks.
IKN Execution Risk
The capital relocation project, while politically committed, faces execution risk common to megaprojects: cost overruns, timeline delays, and lower-than-expected private investment participation. If the first phase (2022-2028) experiences significant delays or budget pressures, confidence in the 23-year roadmap will erode, and alternative uses of capital will become attractive.
XIII. Investment Implications and Strategic Recommendations
For Direct Investors (Manufacturing, Resources)
Opportunity: Indonesia’s domestic market size, infrastructure investment, and supply chain positioning create genuine opportunities in downstream mineral processing, EV battery components, consumer goods manufacturing, and logistics.
Risk Management:
- Long-term contracts for nickel and other minerals should include price escalation and volume flexibility clauses to account for battery chemistry shifts
- Manufacturing investments should target domestic consumption rather than export markets (given TKDN requirements and trade uncertainty)
- Personnel and local management should be prioritized to build relationships with regulators and navigate discretionary permitting
- Infrastructure megaprojects (toll roads, ports, utilities) offer stable returns via PPP structures, but require careful structuring to protect against political risk and currency volatility
For Equity and Growth Investors
Opportunity: Indonesia’s digital economy—e-commerce, fintech, AI services—offers genuine growth at valuations that have compressed from 2021 peaks. Digital platforms (Shopee, GoTo, Bukalapak) are approaching profitability and represent leveraged plays on domestic consumption.
Risk Management:
- Middle-class purchasing power stagnation implies slower user growth and lower average order values than historical trends; valuations should assume 12-15% growth rather than 30%+ growth
- Regulatory policy on social commerce and digital payment licensing has been volatile; fintech exposure should be diversified across multiple business models
- Nickel-related investments (miners, smelters) should be underweighted unless investors have specific views on nickel chemistry resilience
For Infrastructure and ESG Investors
Opportunity: IKN megaproject, toll roads, and renewable energy infrastructure offer long-duration cash flows in a growth market with government backing.
Risk Management:
- Geothermal energy projects offer high returns but face extended development timelines (5-10 years); solar is faster but faces land availability constraints
- IKN investments should assume 15-20 year payback periods rather than 10-15 year assumptions due to execution risk; avoid over-concentration
- Environmental compliance becomes increasingly material given EV battery demand and Western market scrutiny; coal-powered industrial infrastructure carries medium-term devaluation risk
XIV. Conclusion: Growth Engine or Structural Mirage?
Indonesia’s economy has achieved a rare feat: sustaining 5% growth across a decade of global volatility by leveraging two distinct engines—a bottom-up digital revolution and a top-down industrial policy. The 270 million population, youthful demographic profile, and geographic position in a critical EV supply chain create genuine long-term potential.
However, the growth narrative obscures critical structural challenges that will determine whether Indonesia reaches high-income status by 2045 or converges to a middle-income trap. The middle-class contraction, regional inequality, manufacturing export weakness, and coal-battery paradox suggest that headline growth masks underlying household stress and policy tradeoffs between short-term industrial output and medium-term sustainability.
The core strategic tension: Indonesia is pursuing simultaneous and partially conflicting objectives—industrial downstreaming, decentralization, climate transition, and inclusive growth—with finite capital and regulatory capacity. The Prabowo administration’s reforms have increased state control over resource allocation, but at the cost of regulatory unpredictability that may deter the diversified foreign investment needed for sustainable growth.
For the next 3-5 years, Indonesia’s growth will likely persist around 4.7-5.2% driven by infrastructure investment, digital consumption (despite household stress), and nickel/battery production. However, by 2028-2030, the critical tests will emerge:
- Can Indonesia move up the battery value chain despite the shift to LFP chemistries?
- Will the middle class stabilize its consumption share or continue contracting?
- Can IKN and regional infrastructure investments produce tangible decentralization?
- Will renewable energy capacity additions accelerate before coal dependency deepens?
Indonesia is not facing imminent crisis, but it is facing an inflection point. Current policies are well-suited to extracting short-term growth from favorable commodity cycles and domestic digital adoption. Structural transformation toward inclusive, diversified, sustainable growth will require political capital and regulatory discipline that the next administration will need to demonstrate.
official Qatar government websites
| Indonesia.go.id: | Indonesia.go.id: |
Read more country case studies done before this.